Analytics & wallboard
Analytics & wallboard
Telenow gives you three live windows into your call operations, all self-serve from the dashboard:
- Analytics — an org-wide rollup of call volume, outcomes, talk time, and response latency over any date range, optionally filtered to one agent.
- Wallboard — a real-time live-ops screen showing calls in progress and who's available, refreshed every few seconds.
- Per-agent Analysis tab — the same metrics scoped to a single agent, plus the deeper LLM insights (sentiment, dispositions, objections, topics, talk ratio) when post-call analysis is enabled.
None of this needs configuration to start: the volume, outcome, and duration numbers are derived live from your call records. The qualitative LLM layer is opt-in per agent.
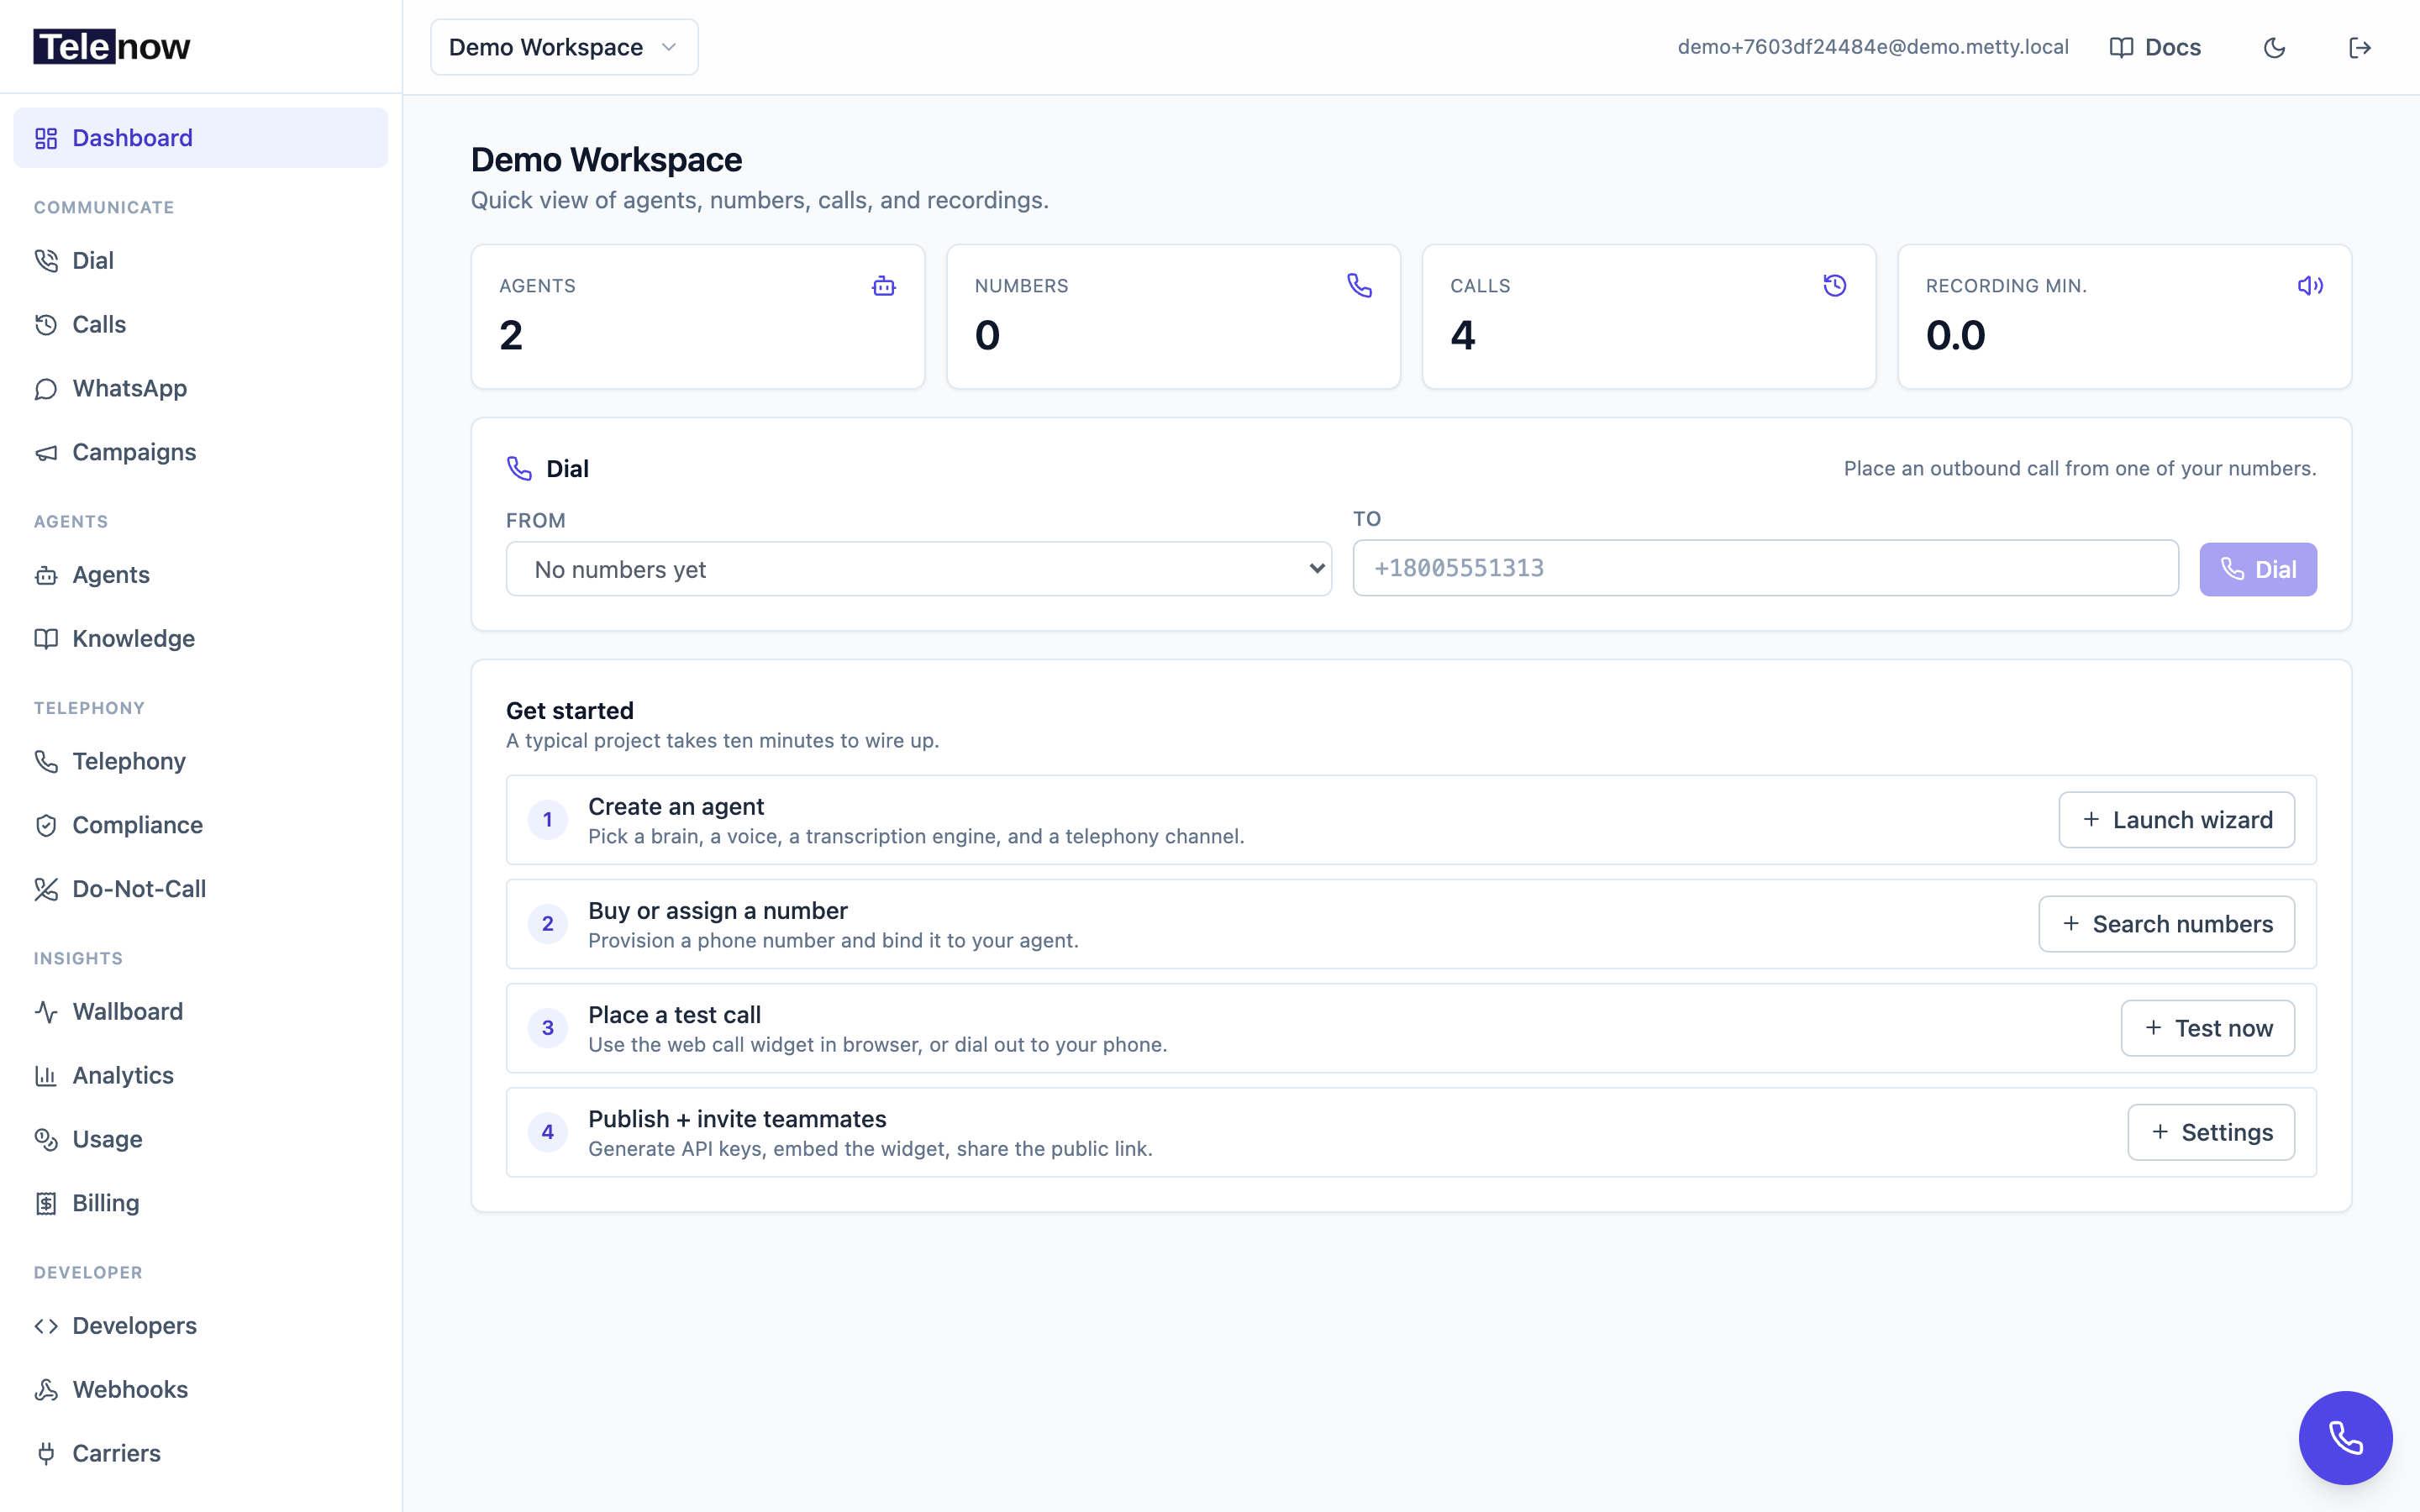
The dashboard's headline metrics. The Analytics page below goes deeper, with date ranges and per-agent breakdowns.
The Analytics page
Click Analytics in the sidebar. You'll see a filter bar, KPI tiles, a daily volume chart, an outcome breakdown, and a per-agent table — all scoped to the window you pick.
Choosing a window
| Control | What it does |
|---|---|
| From / To | Pick the start and end dates (whole UTC days; the end date is included). Defaults to the last 30 days. |
| Agent | Narrow to one agent, or leave on All agents. |
| 7d / 30d / 90d | Quick presets that set the range ending today. |
The range can span up to 366 days. A range longer than that, or a from later than to, is rejected — so the chart always loads fast.
How outcomes are derived
Telenow doesn't store a separate "outcome" column. It derives each call's outcome live from the call's status and duration, so the numbers always agree with the call log:
| Outcome | Rule | Colour |
|---|---|---|
| Completed | Call ended and duration > 0 (someone connected and talked) | Green |
| Missed | Call ended and duration is 0 (no-answer, busy, instant drop) | Red |
| In progress | Call is still active right now | Amber |
| Voicemail | Answering-machine detection (AMD) flagged the call as machine-answered | Amber tile |
Voicemail is a subset of the total — it overlaps the other three rather than being a fourth bucket. It only counts above zero when AMD is enabled on the carrier (see Making calls); otherwise it stays 0.
The KPI tiles
| Tile | Meaning |
|---|---|
| Total calls | Every call in the window (any outcome). |
| Completed | Connected calls, with their share of the total. |
| Missed | Calls that ended with no talk time. |
| Voicemail | Calls AMD flagged as machine-answered. |
| Total minutes | Summed talk time across the window. |
| Avg duration | Mean length of completed calls only (missed calls are excluded so they don't drag it to zero). |
| Avg response | Mean agent response latency — from the moment a caller finishes a turn to the first audio Telenow sends back. Shows — when nothing in the window was measured. |
Avg response is only populated by AI-agent calls that measured at least one turn. Manual softphone calls and pass-through transfers leave it unmeasured, and the carrier (telephony) leg can't be timed server-side — so on a phone call this reflects Telenow's own pipeline plus the network round-trip, not the whole mouth-to-ear delay. See Latency breakdown below for the per-stage view.
Charts and the agent table
- Call volume — one stacked bar per day (green completed, red missed, amber in-progress). Hover a bar for that day's exact counts. With long ranges, only every Nth date label is drawn to keep the axis readable.
- Outcome breakdown — a single proportional bar plus the three headline counts.
- By agent — a table of every agent that had calls in the window: total calls, completed, completion %, and minutes, sorted busiest first.
GET the analytics summary
The page is backed by one dashboard endpoint. It returns the standard { success, data } envelope and is readable by any org member (session JWT, or an API key with X-Org-Id).
GET /api/orgs/{orgId}/analytics?from=2026-05-01&to=2026-05-31&agentId={uuid}
| Query param | Type | Default |
|---|---|---|
from | YYYY-MM-DD (optional) | 30 days before to |
to | YYYY-MM-DD (optional) | today (UTC) |
agentId | UUID (optional) | all agents |
A malformed date (not YYYY-MM-DD), from after to, or a range over 366 days returns 400.
{
  "success": true,
  "data": {
    "from": "2026-05-01T00:00:00Z",
    "to": "2026-06-01T00:00:00Z",
    "totalCalls": 1280,
    "completed": 1041,
    "missed": 198,
    "inProgress": 41,
    "machineAnswered": 73,
    "totalSeconds": 254880,
    "avgSeconds": 244.8,
    "avgResponseMs": 920,
    "daily": [
      { "day": "2026-05-01", "calls": 44, "completed": 38, "missed": 5, "seconds": 9120 }
    ],
    "agents": [
      { "agentId": "…", "agentName": "Support", "calls": 720, "completed": 612, "seconds": 150480 }
    ]
  }
}
| Field | Meaning |
|---|---|
from / to | The resolved window as ISO timestamps. from is inclusive, to is exclusive (it's the start of the day after your end date). |
totalCalls | All calls in the window. |
completed / missed / inProgress | The derived outcomes (rules above). |
machineAnswered | Calls where AMD flagged a machine. A subset of totalCalls, not a fourth category. |
totalSeconds | Total talk time. |
avgSeconds | Mean duration of completed calls only. |
avgResponseMs | Mean response latency in ms; 0 when no call in the window was measured. |
daily[] | One point per calendar day: { day, calls, completed, missed, seconds }. |
agents[] | Per-agent rollup: { agentId, agentName, calls, completed, seconds }. agentName is null for a deleted agent. |
All fields are camelCase. The same endpoint powers the agent Analysis tab — the tab just passes agentId.
The Wallboard
Click Wallboard in the sidebar for a real-time operations screen. It loads a snapshot and then auto-polls every 5 seconds — leave it open on a wall display and it stays current with no clicks. A "Live" badge in the header confirms it's polling.
The wallboard has three sections:
Today's KPI band
Headline numbers for today (from your browser's local midnight to now):
| Tile | Meaning |
|---|---|
| Calls today | All calls started today. |
| In progress | Active calls right now (the tile gets a highlight ring when above zero). |
| Completed | Connected calls so far today. |
| Missed | Calls that ended with no talk time. |
| Avg duration | Mean length of today's completed calls. |
Calls in progress
A table of every active call, longest-running first — the order ops cares about:
- Who — the agent's name for an AI call, or the member's email for a manual softphone call (with a headset/bot icon).
- From / To — the two numbers on the call.
- Duration — ticks up every second client-side (no refetch), so the clock stays smooth between polls. If a call actually ends server-side, the row clears on the next 5-second poll.
- Type — AI agent or softphone.
- View — jumps to the call detail page.
Team roster
Every member of the org with a live presence dot:
| Dot | Meaning |
|---|---|
| Amber | On a call right now (click On a call → to open it). |
| Green | Online — has the dashboard open within the presence freshness window. |
| Grey | Offline — shows "Seen N ago" if they were recently present. |
Presence uses the same signal that drives inbound ring-to-browser routing (see Team & workplace): a member counts as online only if their dashboard has checked in recently. The row also notes their role and whether they're set to receive calls.
GET the wallboard snapshot
GET /api/orgs/{orgId}/wallboard?since={ISO8601}
since is the client's local midnight (the page sends it automatically); omit it and the backend falls back to UTC midnight, which may not match your timezone. Readable by any org member.
{
  "success": true,
  "data": {
    "now": "2026-06-13T10:22:05Z",
    "members": [
      {
        "userId": "…", "name": "Sarah Chen", "email": "[email protected]",
        "role": "admin", "receiveCalls": true,
        "live": true, "lastSeenMs": 1749810120000, "onCallId": null
      }
    ],
    "activeCalls": [
      {
        "id": "…", "agentName": "Support", "callMode": "ai",
        "from": "+14155550100", "to": "+14155550111",
        "startedAt": "2026-06-13T10:19:40Z", "initiatedByEmail": null
      }
    ],
    "today": {
      "total": 88, "completed": 71, "missed": 12,
      "inProgress": 5, "totalSeconds": 21340, "avgSeconds": 300.6
    }
  }
}
| Field | Meaning |
|---|---|
members[].live | true when the member is present within the freshness window. |
members[].lastSeenMs | Last-seen epoch ms (drives the "Seen N ago" label), or null. |
members[].onCallId | Session id of the manual call this member is on, or null. |
activeCalls[].callMode | manual for a softphone call; anything else is an AI agent call. |
today | The same of-today totals shown in the KPI band. |
Tip — the wallboard's
todaytotals are scoped to today only. For a custom date range or a per-agent split, use the Analytics page instead.
The per-agent Analysis tab
Open any agent (sidebar Agents → click an agent) and select the Analysis tab. It has two layers.
Always shown (no setup)
These come straight from your call records, so they render for every agent:
- KPI tiles — calls, completed, messages per session, average call length, total minutes, and average response latency, over a 7d / 30d / 90d range you toggle at the top.
- Call volume — the same stacked daily bar chart as the org page, scoped to this agent.
Latency breakdown
When the agent has at least one measured call, a Latency breakdown panel shows where each turn's time goes, averaged across measured calls:
| Stage | What it measures |
|---|---|
| STT | Speech-to-text — transcribing the caller. |
| LLM | The model deciding what to say. |
| TTS | Text-to-speech — synthesizing the reply. |
| Server (overall) | The full server response: transcript → first audio out. |
| Web ⇄ server | The browser WebSocket round-trip (web calls only). |
Each value is colour-toned: green up to ~1.2s, amber to ~2.5s, red beyond. The carrier (telephony) leg can't be measured server-side, so on phone calls this is the server pipeline plus the web round-trip, not the full mouth-to-ear time. The panel notes how many calls fed the averages. See Post-call analysis for the qualitative side, and Making calls for what affects these numbers.
Shown only with post-call analysis on
If the agent doesn't have post-call analysis enabled, the tab shows a card inviting you to turn it on (one click takes you to the agent builder's Analysis step). Once enabled, calls going forward are analyzed automatically (the worker picks them up within ~30 seconds of a call ending — it doesn't back-fill old calls), and the tab adds:
- Insight tiles — analyzed-call count, average quality score (0–100), how many calls had hallucination flags, and the positive-sentiment share.
- Sentiment trend — a daily stacked bar of positive / neutral / negative.
- Dispositions and Top objections — side-by-side bar charts of the outcome labels and concerns surfaced from the conversations.
- Avg talk ratio — an agent-vs-customer split bar, computed deterministically from word counts.
- Topics & keywords — frequency-sized bubble clouds.
- Recent analyzed calls — the latest 50 analyzed calls with score, sentiment, disposition, summary, and a hallucination-count badge; click Open for the full call.
At the bottom, a Caller memory section lists the callers this org's agents remember, with a trash icon to erase one caller's memory (a GDPR/DPDP tool). Caller memory is org-shared, so erasing it removes that caller from every agent's memory. See Caller memory.
Agent analysis API
These are dashboard routes — { success, data } envelope, org-scoped via the X-Org-Id header (the same one /agents/:id/stats uses):
| Method | Path | Returns |
|---|---|---|
GET | /api/agents/{id}/analysis/rollup?from&to | KPIs + sentiment trend, disposition breakdown, top objections, top topics/keywords, talk-ratio word totals |
GET | /api/agents/{id}/analysis/calls?from&to&limit | Recent analyzed calls (default limit 50) |
GET | /api/agents/{id}/analysis/memory | Org-shared caller memory rows |
DELETE | /api/agents/{id}/analysis/memory?caller={callerKey} | Erase one caller's memory → { removed } |
The rollup response is { from, to, rollup }, where rollup carries total, avgScore, hallucinationCalls, positive/neutral/negative, agentWords/customerWords, sentimentTrend[], dispositionBreakdown[], topObjections[], topTopics[], and topKeywords[]. from/to here are ISO timestamps (not date strings). These read empty until post-call analysis has run on at least one call in the window. For the per-field meaning of the underlying analysis, see Post-call analysis.
Tips
- The Avg response and Latency breakdown numbers only reflect AI-agent calls that measured a turn. If you mostly run manual softphone calls, expect them to read —.
- To see a single agent's volume and outcomes, you can either use the org Analytics page's Agent filter or open that agent's Analysis tab — they call the same endpoint.
- The wallboard is meant to stay open. Pin it to a shared screen; it refreshes itself.
- Want analytics pushed somewhere instead of pulled? The
call.analyzedwebhook fires when each call's analysis completes — wire it into your warehouse or CRM and skip the polling.
Troubleshooting
- "No calls in this range" — widen the date range or clear the Agent filter. The page only shows when the window has at least one call.
- Voicemail tile is always 0 — answering-machine detection isn't enabled. AMD is a carrier/campaign feature; turn it on where you place the calls (see Making calls).
- Avg response shows — — nothing in the window measured a turn. This is normal for manual or pass-through calls; only AI-agent calls contribute.
- A member shows offline but is working — presence is dashboard-open-based. If they only use the softphone in a background tab or have the dashboard closed, they read offline. It's the same gate as inbound ring-to-browser routing — see Team & workplace.
- Wallboard "today" doesn't match my clock — the page uses your browser's local midnight. If you call the API directly without a
sinceparam, it falls back to UTC midnight. - Analysis tab shows only the basics — post-call analysis isn't enabled for that agent. Open the agent builder's Analysis step and turn it on; new calls are analyzed from then on.
Related
- Post-call analysis — configuring sentiment, dispositions, custom fields, and the QA scorecard that feed these rollups.
- Usage & billing — metered usage, quotas, and per-agent charge breakdowns.
- Analytics & usage API — the reporting and usage/quota endpoints in API-reference form.
- Audit log — the who-did-what compliance trail (separate from call analytics).
- Caller memory — the org-shared memory listed and erasable on the Analysis tab.
- Calls, recordings & insights — where individual analyzed calls surface.